Copernicus Ambassador · Ireland — Maynooth University is a member of the EU Space NetworksLatest: Sentinel-3C returns its first views of Earth →
Home / EO in action

Earth Observation in action across Ireland

Four sectors, one pattern: the Irish question, what satellites show, the Copernicus inputs, who uses them, and real Irish examples.

Agriculture & Forestry

Climate-smart land management, field by field

Where is grass growing or under stress? Has a field been mowed or ploughed? Where has forest been felled, damaged or burned?

Grassland covers most of Ireland’s farmland. Sentinel-2 vegetation indices show how it is growing, and Sentinel-1 radar keeps the record going through cloudy weeks. In forests, satellite data combined with field measurements gives timber volume, canopy change and storm damage.

Copernicus inputs

Sentinel-1 SARSentinel-2 NDVICLMS high-resolution layersC3S seasonal outlook

Irish users

DAFMTeagascCoillteNPWSEPAFarmers & forestersAgri-food firms
High-resolution NDVI map of arable fields. Green marks vigorous vegetation; orange and red mark bare or ploughed soil with visible tramlines.
NDVI · RED = BARE SOIL / LOW VEGETATION · GREEN = VIGOROUSNDVI is an indicator of vegetation vigour. It does not measure yield directly.
DAFM · Compass Informatics (Tracsis)

Area Monitoring System for CAP

Sentinel imagery and machine learning classify crops and land use, detect mowing and ploughing, and link results to the national land parcel database. Dashboards support CAP decision-making.

Data: Sentinel-1, Sentinel-2 · Read the case
Treemetrics · Cork

Forest intelligence

Treemetrics combines satellite EO with field data to estimate forest inventory, harvest planning and change, supporting climate-smart forestry in Ireland and abroad.

Data: satellite EO + field data

Teagasc · NCG Terrain-AI

Grassland, land use and carbon

Teagasc applies satellite and drone EO to grass and crop research and advice. The NCG-led Terrain-AI work models land use and land-use change to support carbon accounting.

Data: Sentinel-2 time series, drone surveys

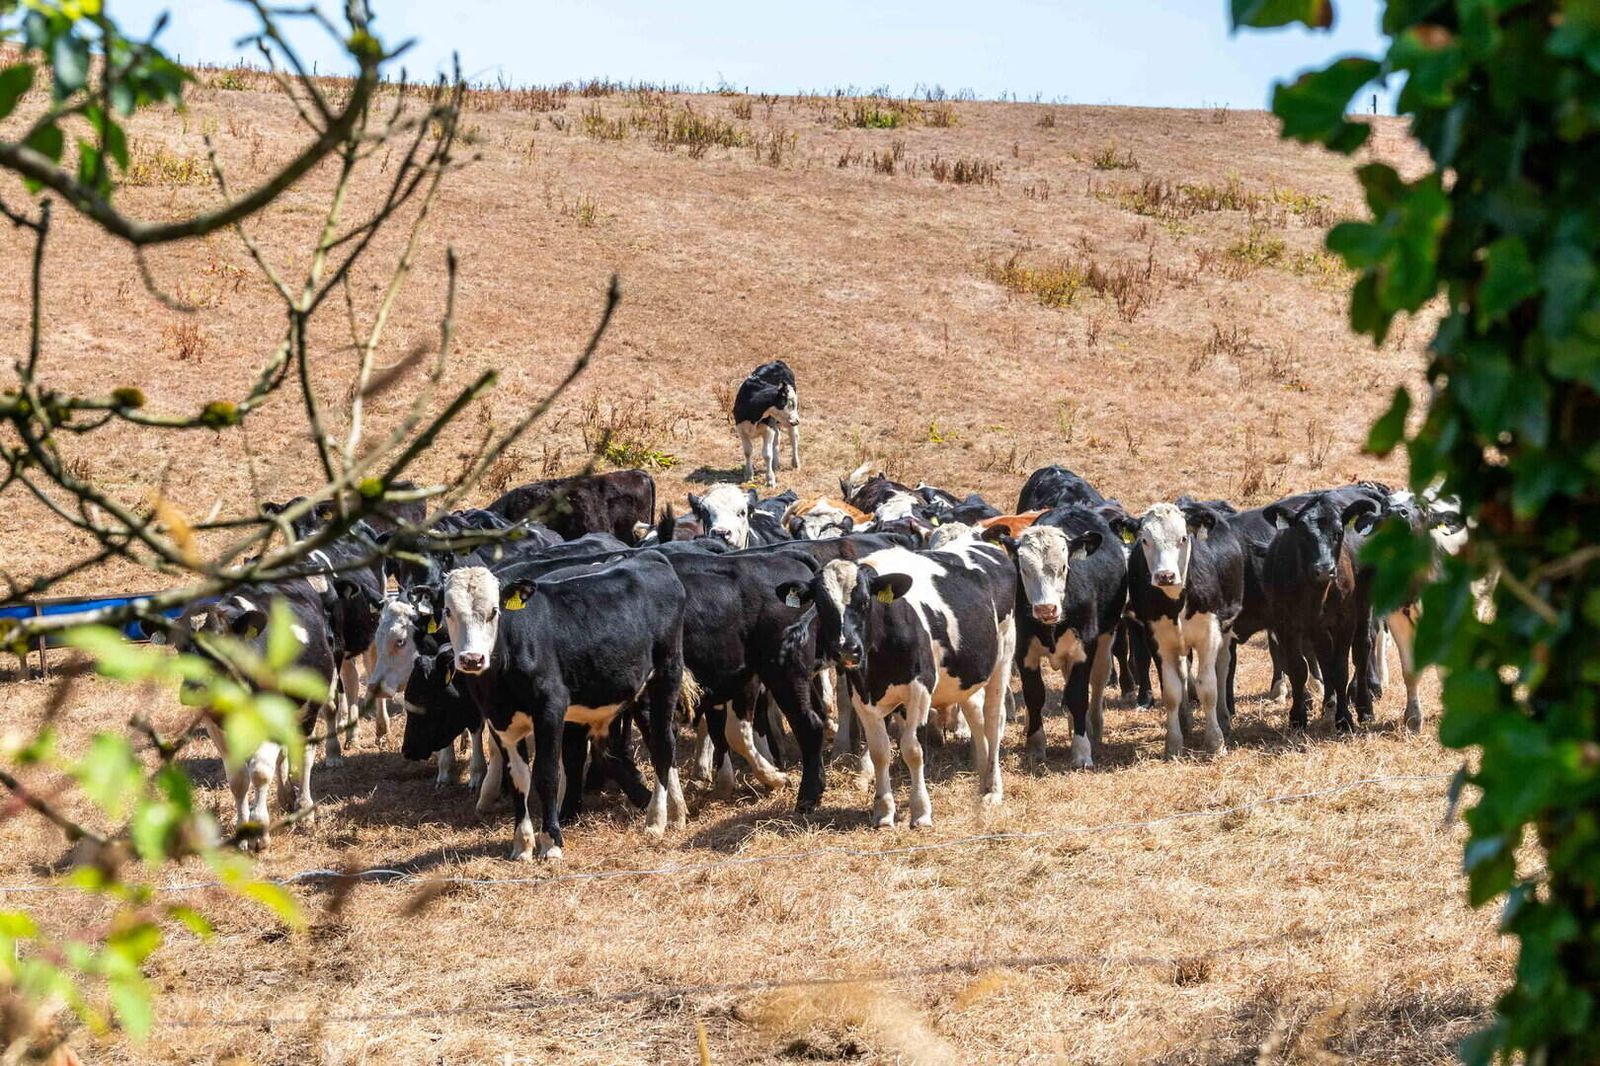
Beef cattle gathered on parched, brown pasture during a summer drought.
DROUGHT STRESS · GRASSLANDDry summers show up quickly in Sentinel-2 vegetation indices. National maps help advisers see where grass supply is falling short.
Wildfire & recovery

Burn scars and replanting

After the 2025 upland and forest fires in Roscommon and Wexford, Sentinel-2 shortwave-infrared bands can map burned area and severity, guide replanting and track recovery over several seasons. The same methods apply to flood damage, drought stress and overgrazing.

Data: Sentinel-2 SWIR (burn ratio), EFFIS

Climate Change

Evidence for a changing Irish climate

How are temperature, rainfall and drought patterns changing? What does the coming season look like? Where are peatland, coastal and urban-heat risks growing?

Weather is what happens this week. Climate is the long-term pattern. The Copernicus Climate Change Service (C3S) compares each month and season with a 30-year reference period, so a warm spell can be read against what is normal for Ireland.

Copernicus inputs

C3S anomaliesERA5 reanalysisC3S seasonal forecastsCAMS greenhouse gasesCLMS land-cover change

Irish users

EPAMet ÉireannDept of ClimateLocal authoritiesClimate Action Regional OfficesICARUS (MU)MaREI
C3S map of Europe classifying surface air temperature from coolest to warmest relative to 1991 to 2020. Ireland is much warmer than average; Britain and France are in the warmest category.
C3S · SURFACE AIR TEMPERATURE · REF. 1991–2020Ireland falls in “much warmer than average”, with Britain, France and much of central Europe in the warmest category. Source: Copernicus Climate Change Service / ECMWF.
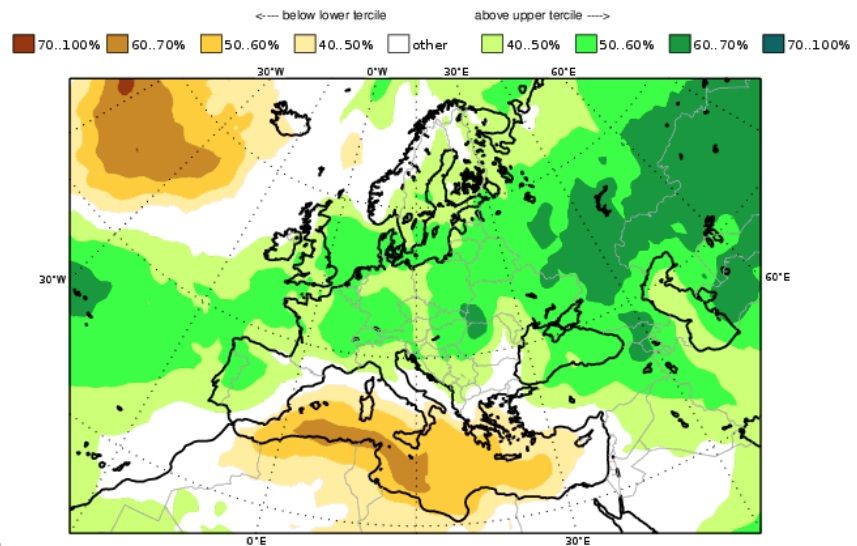
C3S seasonal forecast map showing the probability of precipitation above the upper tercile in green and below the lower tercile in brown. Ireland is light green.
C3S MULTI-SYSTEM SEASONAL FORECAST · PRECIPITATION TERCILESGreen: wetter than normal is more likely. Brown: drier is more likely. Ireland shows a 40–50% chance of an upper-tercile (wet) season.
EPA · Met Éireann · ICARUS

National climate indicators

ERA5 reanalysis and satellite climate records fill gaps between weather stations and extend Irish records back to 1940. They support EPA climate reporting and Met Éireann’s climate services.

Data: C3S ERA5, ERA5-Land, satellite climate data records

Peatlands · Cities

Bogs, carbon and urban heat

Sentinel-1 and -2 track peatland wetness, rewetting and fire scars, which matter for Ireland’s land-use emissions. Thermal and land-cover data show urban heat islands in Dublin, Cork and Limerick.

Data: Sentinel-1/-2, Landsat thermal, CLMS imperviousness

Marine

Ireland’s seas as one connected system

What are sea state and currents doing? Where are algal blooms, sediment plumes or pollution risks? How is the coast changing? Which vessels are at sea?

Ireland’s marine area is about ten times its land area. Satellites are the only practical way to watch all of it. Copernicus Marine models and Sentinel ocean-colour, altimetry and radar data support fisheries, aquaculture, offshore energy, ports and maritime safety.

Copernicus inputs

Copernicus Marine (CMEMS)Sentinel-3 ocean colour & SSTSentinel-1 SARSentinel-2 coastalSentinel-6 altimetry

Irish users

Marine InstituteIrish Coast GuardSFPANaval ServiceCommissioners of Irish LightsPortsOffshore windAquaculture
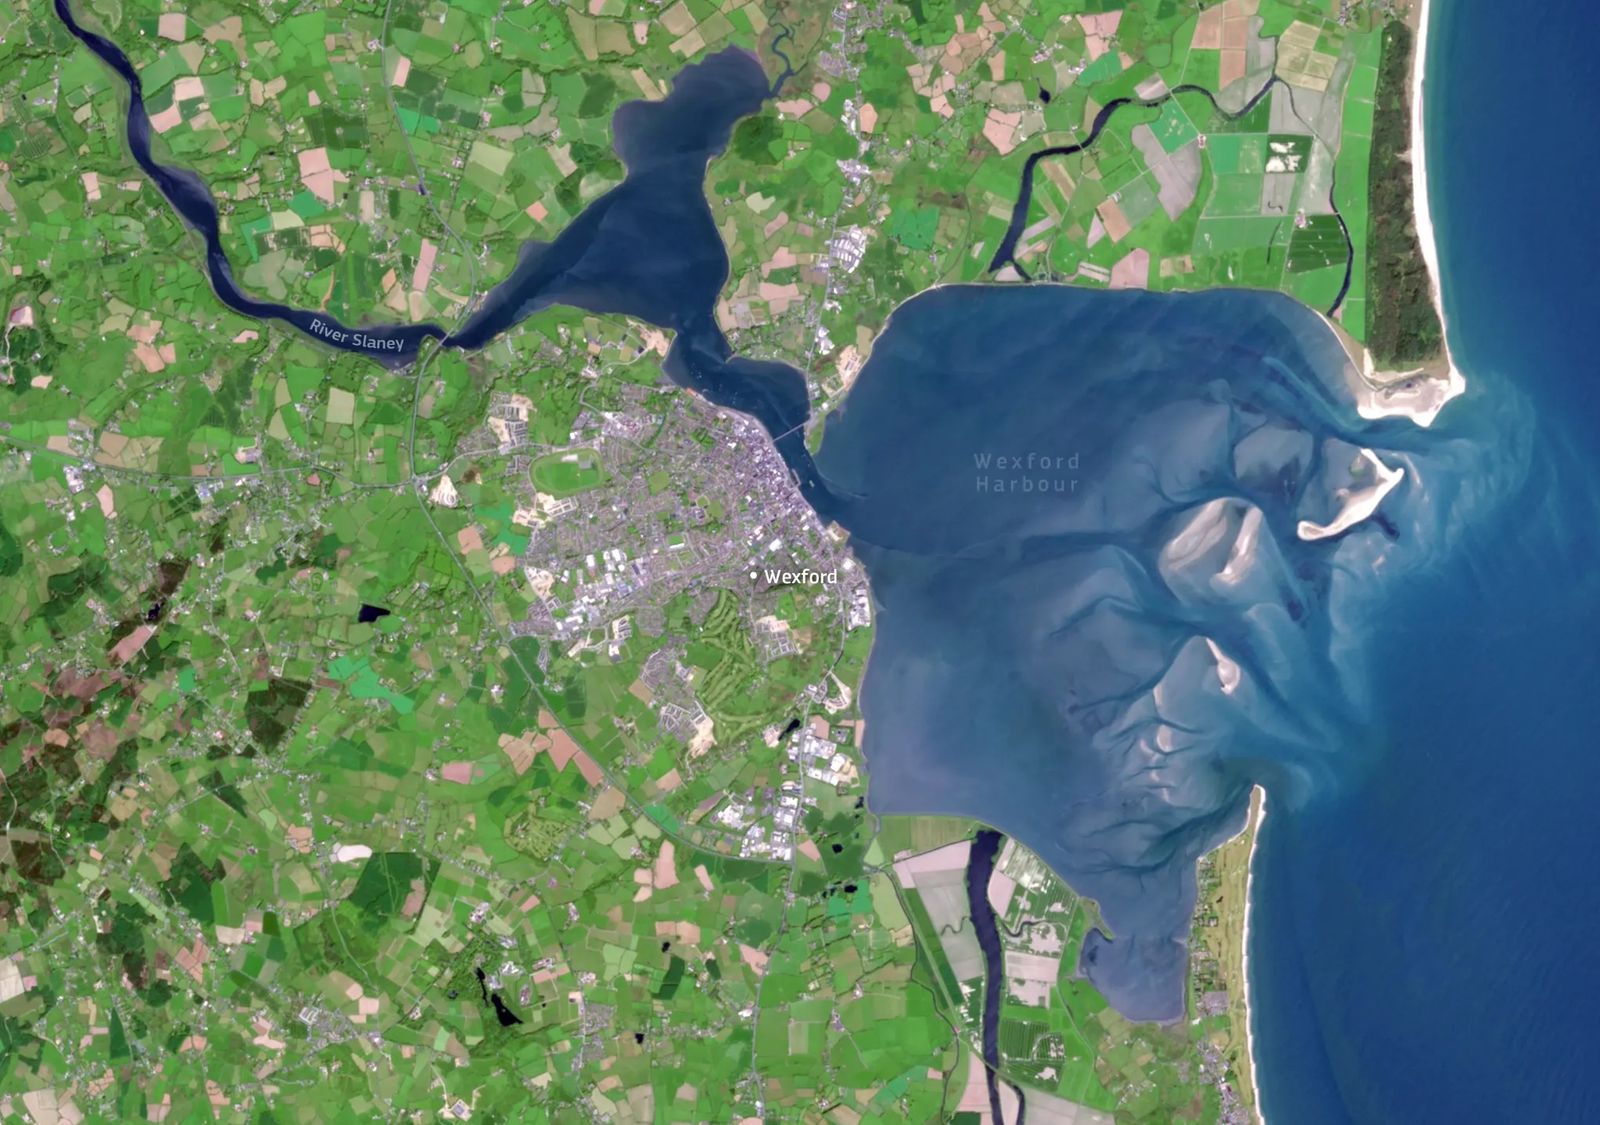
Sentinel-2 image of Wexford Harbour showing sediment-laden water, tidal channels and sandbanks.
SENTINEL-2 · WEXFORD HARBOUR · TRUE COLOURTidal channels and suspended sediment are visible across the harbour. Sentinel-2 and -3 colour data are used to map turbidity and chlorophyll.
Marine Institute

Ocean forecasting and observation

Copernicus Marine products set the boundary conditions for regional Irish ocean models. They support forecasts of currents, temperature and harmful algal blooms for aquaculture and safety.

Data: CMEMS Atlantic–Iberian Biscay Irish Seas products

TechWorks Marine · Dún Laoghaire

Data buoys meet satellites

TechWorks Marine combines in-situ metocean systems with EO, GIS and machine learning to monitor water quality and conditions for ports, aquaculture and offshore projects.

Data: in-situ sensors + Sentinel-2/-3

NCG Maynooth · authorised users

Vessel detection with radar

Sentinel-1 SAR picks out ships day and night. Matching detections against AIS reveals “dark” vessels for maritime-security research. Copernicus Security products are open to authorised authorities only.

Data: Sentinel-1 SAR, AIS

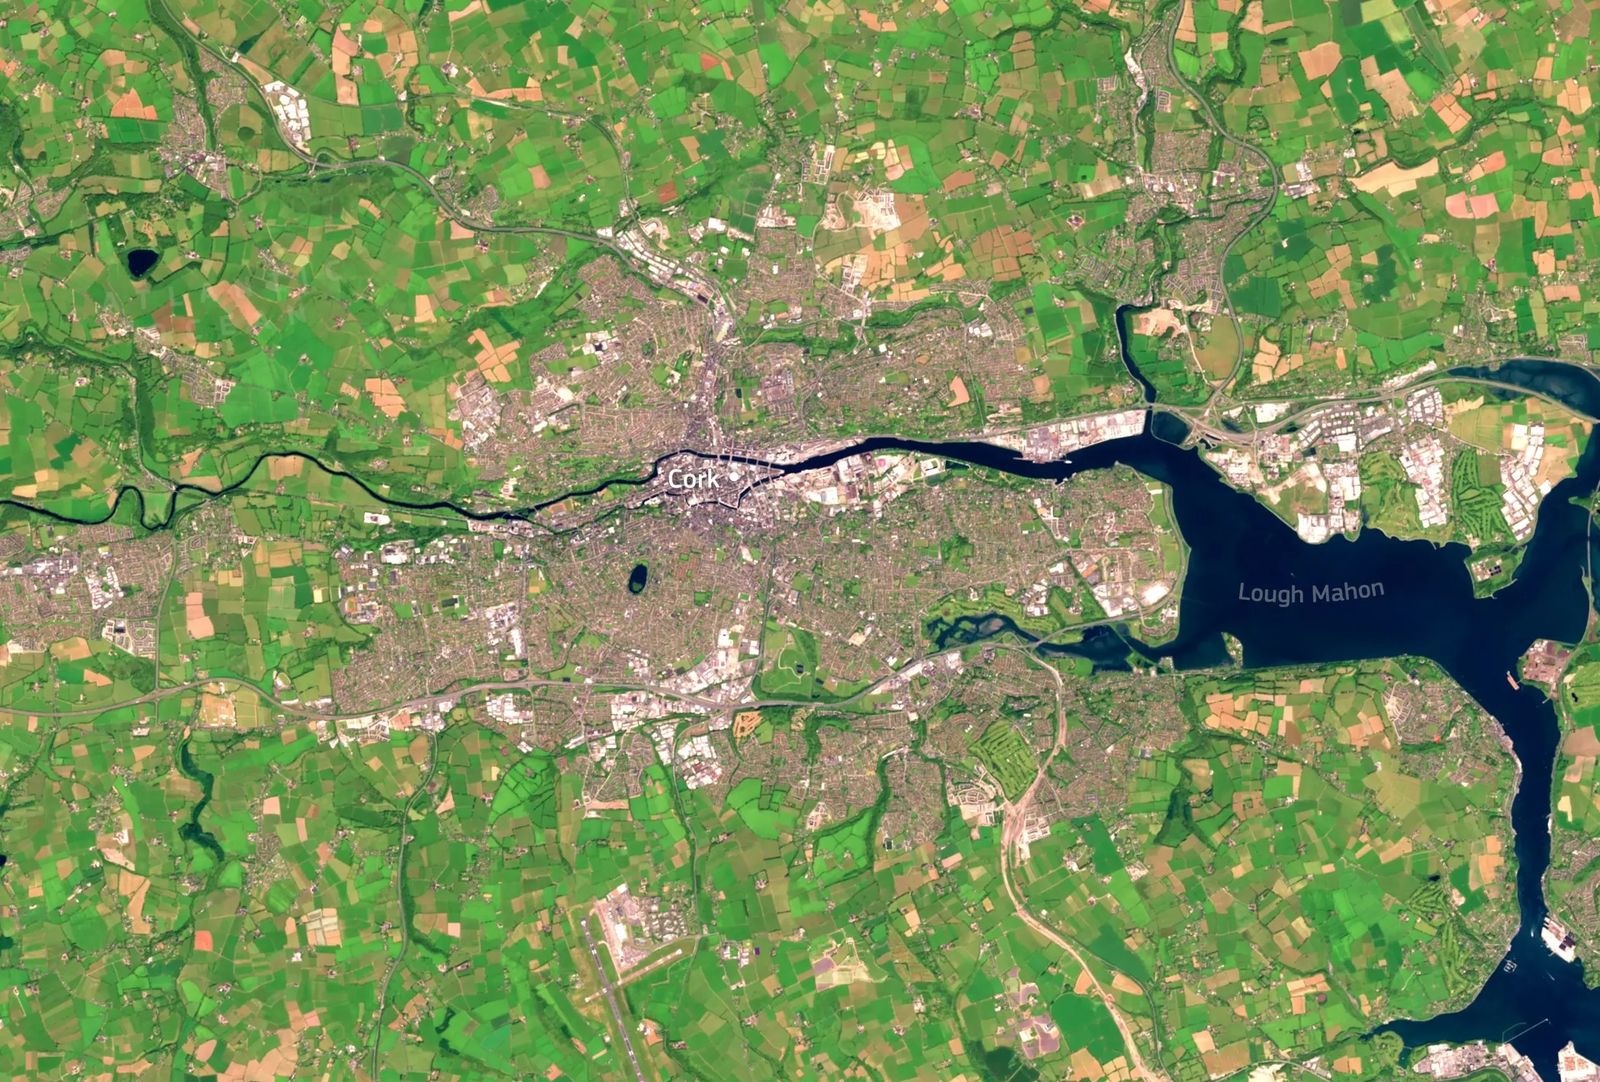
Sentinel-2 image of Cork city, the River Lee and Lough Mahon in Cork Harbour, with surrounding farmland and Cork Airport.
SENTINEL-2 · CORK CITY & LOUGH MAHON · TRUE COLOURThe Lee runs through Cork city into Lough Mahon and Cork Harbour, one of the world’s largest natural harbours. Port, city and farmland can be monitored together.
Emergency Response

Flood maps, even through the cloud

Where is flooding observed or likely? Which homes, roads and rail lines are affected? What area burned? How is recovery going?

Sentinel-1 radar sees floodwater through the cloud that comes with Irish storms. The Copernicus Emergency Management Service (CEMS) turns this into rapid maps of flood extent and the people, buildings and infrastructure affected. National authorised users request rapid mapping. Many maps can then be viewed and downloaded by anyone.

Copernicus inputs

CEMS Rapid MappingEFAS flood awarenessEFFIS wildfireSentinel-1 flood mappingSentinel-2 burn severity

Irish users

NDFEMOPWMet ÉireannLocal authoritiesFire servicesCivil DefenceCoast GuardUtilities
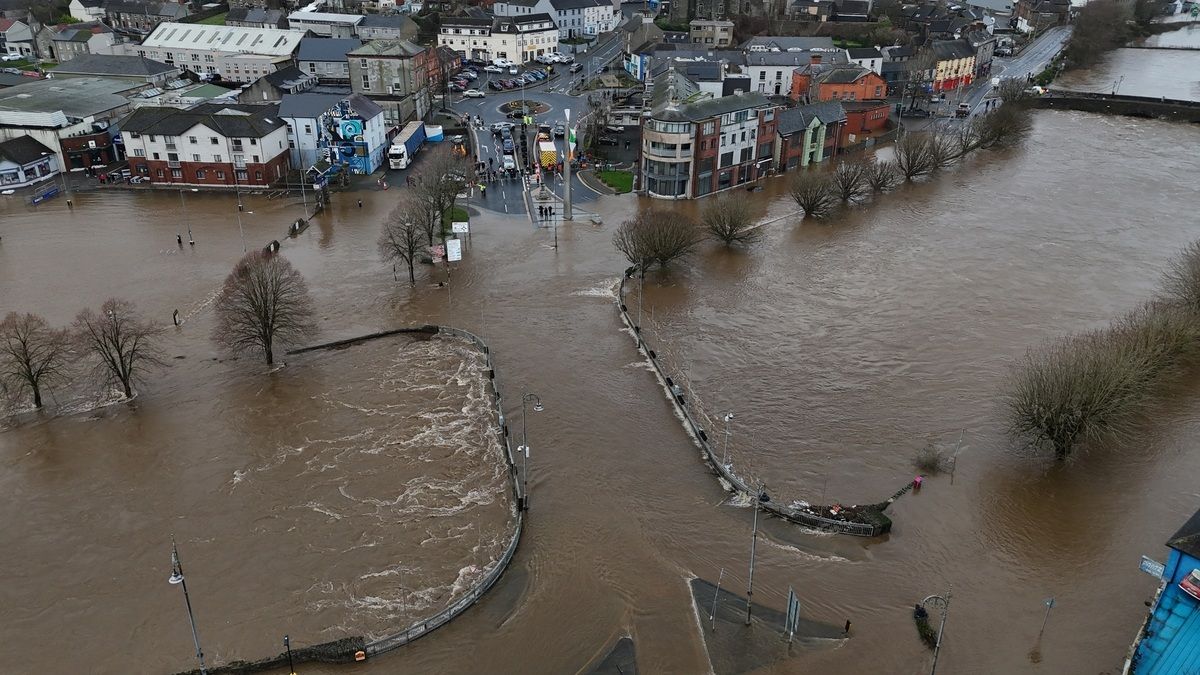
Drone photograph of an Irish town centre flooded by a river in spate, with brown floodwater over roads and around buildings.
AERIAL · RIVER FLOODING · TOWN CENTREDrone and aerial imagery add street-level detail to satellite flood maps during and after an event.
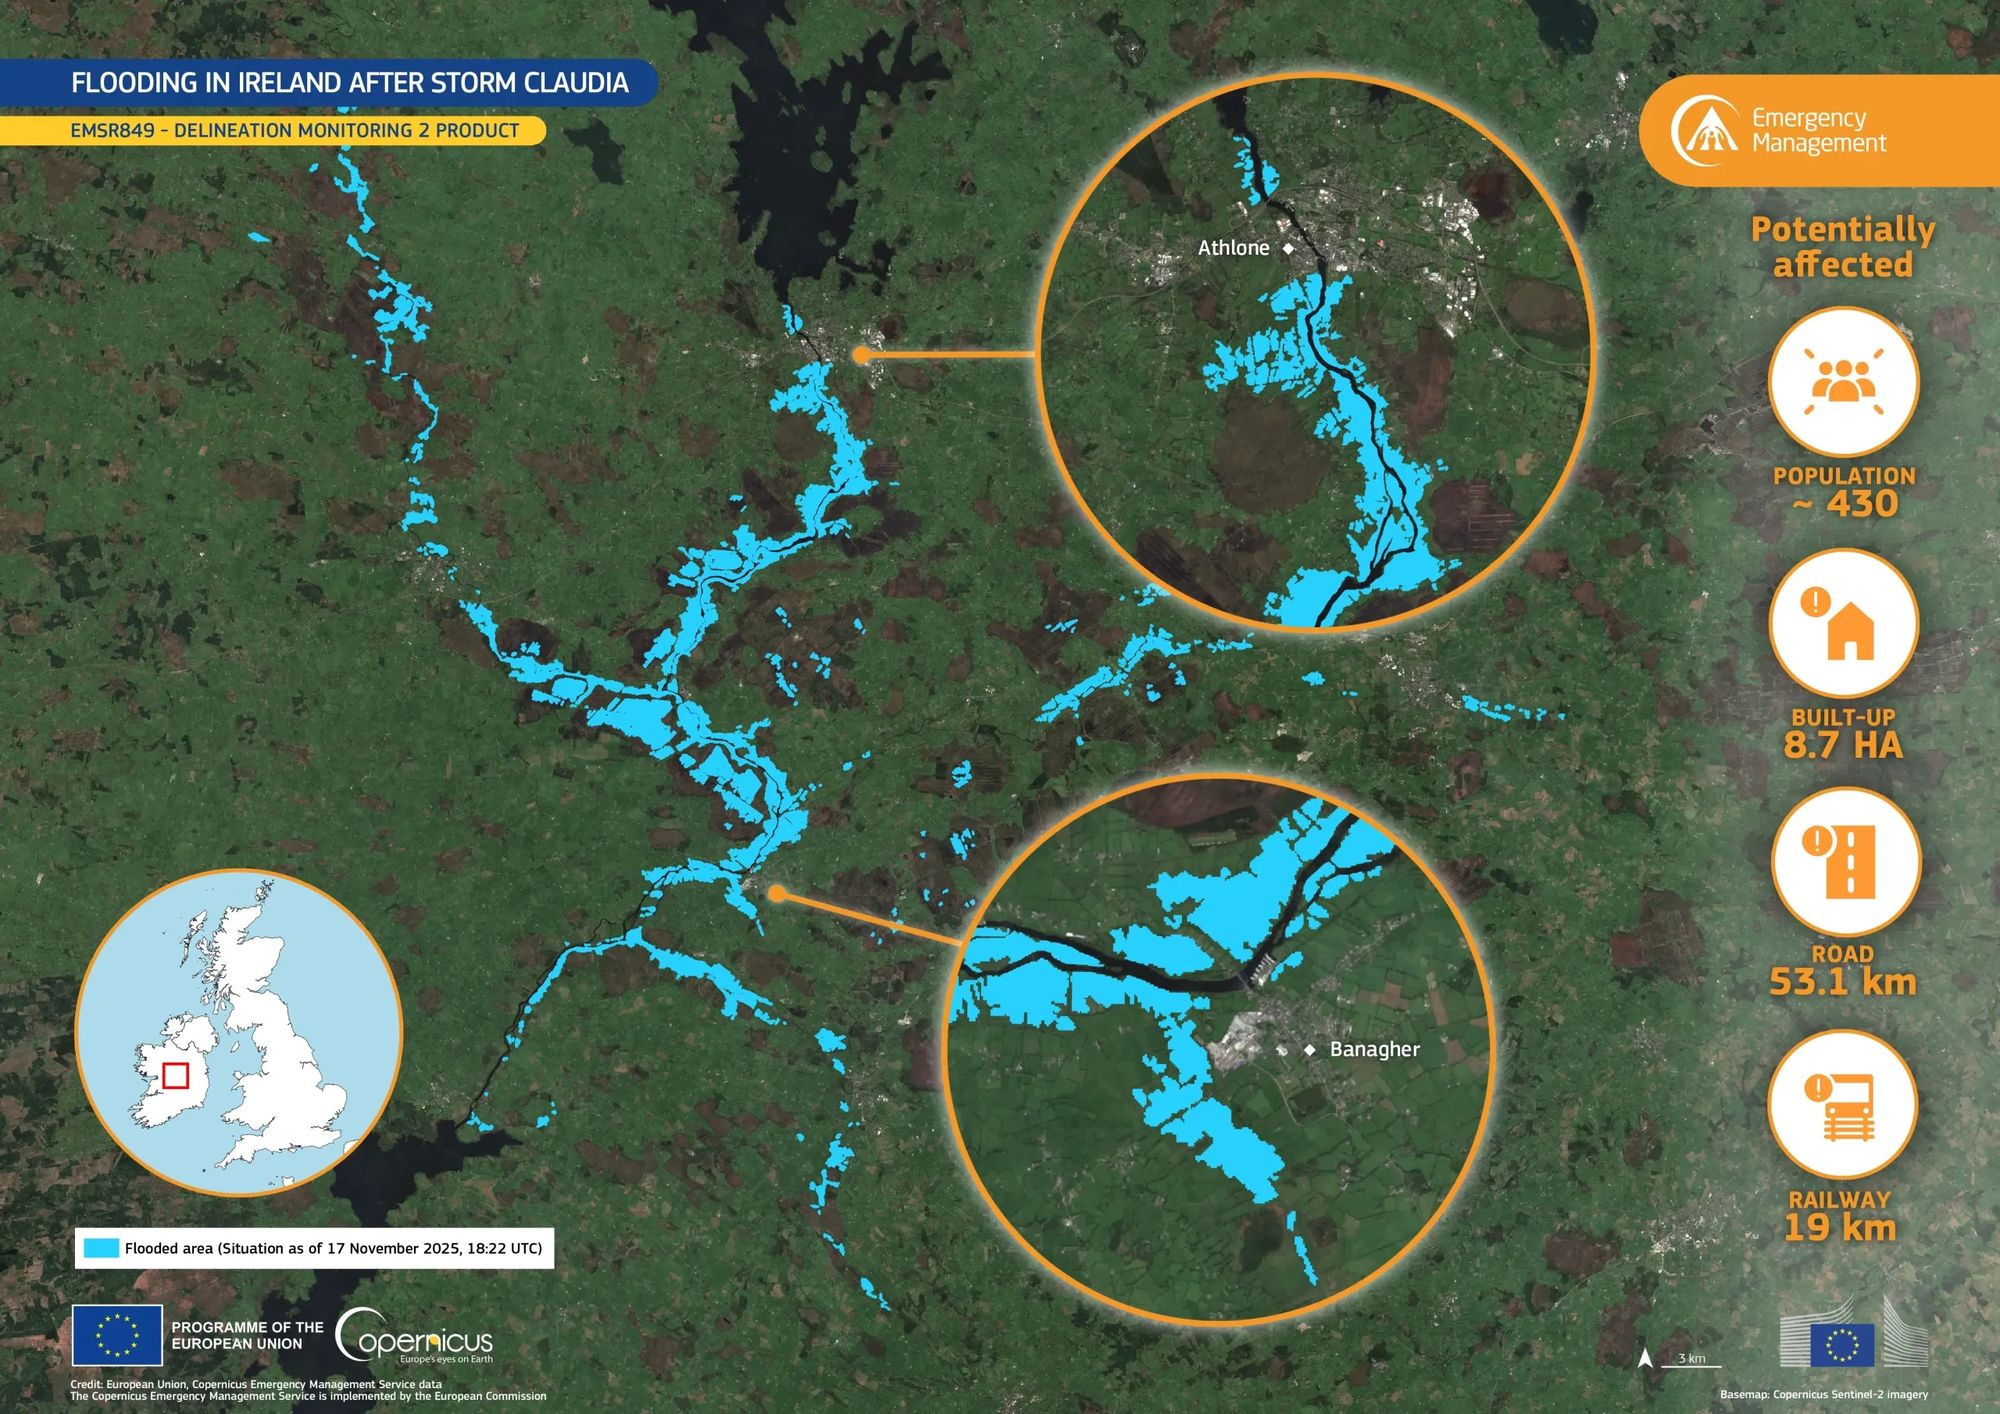
Case study · CEMS activation EMSR849

Storm Claudia: the Shannon from Athlone to Banagher

CEMS delineation monitoring map of flooding along the River Shannon after Storm Claudia, with insets for Athlone and Banagher and impact figures.
CEMS EMSR849 · DELINEATION MONITORING 2 · SITUATION 17 NOV 2025, 18:22 UTCFlooded area in blue over a Sentinel-2 basemap. Credit: European Union, Copernicus Emergency Management Service data.
~430people potentially affected
8.7 habuilt-up area
53.1 kmroads
19 kmrailway
WarningMet Éireann warnings; EFAS flags high flows
ActivationAn authorised user requests CEMS mapping
MappingSentinel-1/-2 and commercial imagery delineate floods
RecoveryRepeat maps track water receding and damage

Have an Irish EO story to share?

We feature Irish case studies from agencies, companies and researchers. Send a short summary, an image and its credit line to eodatahub@mu.ie.

Find an Irish EO partner