Create and Apply the Right Color Palette in Adobe Photoshop for your Map Visualization (Part 3 of 3)NASA Earth Observations (NEO)on October 28, 2020 at 12:50 pm

We have added the NEO color table to a grayscale image, learned how to accommodate the color blind easily with our maps, and now we are ready to build custom color palettes.
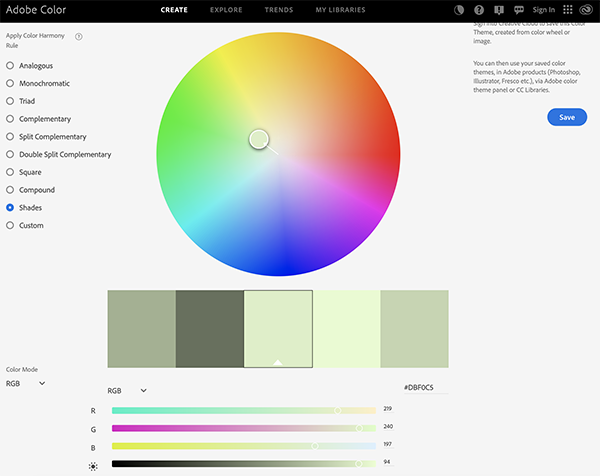
Adobe has an online color wheel that is helpful to use when surfing through different colors. If you are unsure what colors to start with, use the color wheel to give you a few ideas and follow these three steps as a guide for applying colors to your map with the wheel:
Step 1. Play around with the different color functions of the wheel to find a palette you would like to work with. You can work with a different hue and saturation of one color or look at three different complimentary colors. The radio buttons on the side of the wheel will help guide your decision-making. The RGB value for each color is at the bottom. Feel free to also mess with the lightness, hue and saturation sliders to get exactly what you want after the color wheel gives you an output. I decided to use the shades function and make a minty green palette. I plan to use these colors for land and then choose a contrasting color for the water.
My color wheel choice for this example.
Step 2. Open the color table back up for the grayscale image and use the same method as before: Select a couple of rows and change the colors to what you selected on the wheel, gradually moving from light to dark down the color table. Or, see what happens when you move from dark to light down the color table. Does it change the message of the map?
Step 3. Save your color palette for future use.
Alright, I know, that was short and easy. But not so fast, we have a couple more things to learn.
Follow these steps to make your own color palette in Photoshop:
Step 1. Open a new project for a clean slate to make palettes on. Do not worry about the canvas size as long as you have enough space to work with.
Step 2. Using the brush tool at a size that is easy to see, pick and paint a color on the canvas that you want on your map. I chose green because that is what I think of when I think of vegetation.
My Canvas so far.
Step 3. Now open the Color Picker back up and select a color that is lighter (less saturated) and move the hue up the color scale a little bit. Repeat this process but in the other direction for your third color. There is a tutorial by Greg Gunn that has a very similar process but is way more detailed. Please check out the video if you need a little more context on choosing the right colors.
I have selected and changed the hue and saturation to a part of the colors I am working with but this is not necessary. Do what is right for you.
Step 4. I have chosen a few colors to work with and am ready to add them to the color table. Clip the canvas to the colors you would like on your map. Go to Image, Mode, and select Indexed Color. Now open up the Color Table under Image, Mode. The colors you have chosen may be scattered around the table.
Step 5. Select one of your lightest colors on the table and add it to the 5th and 6th rows using the RGB values located on Color Picker. I may choose to add the same colors to three rows instead of two but this is a good starting place.
Step 6. Create a lighter color from the one you just filled in the 5th and 6th rows by toggling hue and saturation in Color Picker and add it to the 3rd and 4th rows. Repeat this process for rows 1 and 2.
Step 7. Now pick a second color that is darker than rows 5 and 6 and add it to rows 7 and 8. Repeat this process all the way down.
Step 8. Choose and apply a contrasting color for the last cell to represent water.
Here is what I came up with after Step 8.
Step 9. Save the color table somewhere that is easy to find and open up a new project with the grayscale NDVI map.
Step 10. Change the mode to Indexed Color and open up the Color Table.
Step 11. Load the color table you just created and see what you think. Feel free to change the colors up or maybe even repeat the steps with an entirely new set of colors. This tutorial is not available to get it right on the first try. We simply want to give you the tools you need to make the right map for your needs.
What do you think? Not bad for a first try?NASA Earth Observations (NEO)This is part 3 of a three-part series focused on creating custom color palettes and applying them to a grayscale map.


