OBSERVER: Supporting policy making with science – a decade of Copernicus services at ECMWF
OBSERVER: Supporting policy making with science – a decade of Copernicus services at ECMWF
sonia
Wed, 06/08/2025 – 13:34
Over the past decade, Copernicus has been at the forefront of Earth Observation (EO), delivering a constant stream of high-quality data to support evidence-based policymaking and enable informed decisions across both the public and private sectors. It has helped to guide climate action initiatives, shape air quality strategies, and improve public health and socioeconomic well-being across Europe. This role has been captured in a landmark publication from the European Centre for Medium-Range Weather Forecasts (ECMWF), “Ten years of Copernicus at ECMWF”.
The report, issued on the occasion of ECMWF’s 50th Anniversary, outlines how the centre implements and delivers two core Copernicus Services, the Copernicus Climate Change Service (C3S) and the Copernicus Atmosphere Monitoring Service (CAMS), highlighting their sustained contribution to science, policy, and society. In this Observer, we look at how CAMS and C3S have helped support policy making over a decade of implementation by ECMWF.
CAMS: Monitoring Europe’s atmosphere and supporting clean air policy
CAMS has become an essential resource for monitoring air quality and atmospheric composition, using both regional and global modelling systems to provide near real-time forecasts. It delivers information on the concentration, distribution, and evolution of pollutants and greenhouse gases (GHG) in the atmosphere, as well as on emissions inventories, solar irradiance levels, and climate forcing variables. The service achieves this by combining observations from satellites and in situ measurements. These inputs are integrated into the CAMS modelling systems to map and forecast the concentration and distribution of various atmospheric pollutants at the global, regional, and European scales. The ECMWF Integrated Forecast System for atmospheric composition (IFS-COMPO[1]) covers the globe, while an ensemble of 11 European regional chemistry-transport models is used to assess air quality in Europe. The atmospheric pollutants considered include reactive gases, such as ozone, nitrogen dioxide, sulphur dioxide and volatile organic compounds, and aerosols including sulphate, organic matter, black carbon, desert dust, and sea salts.
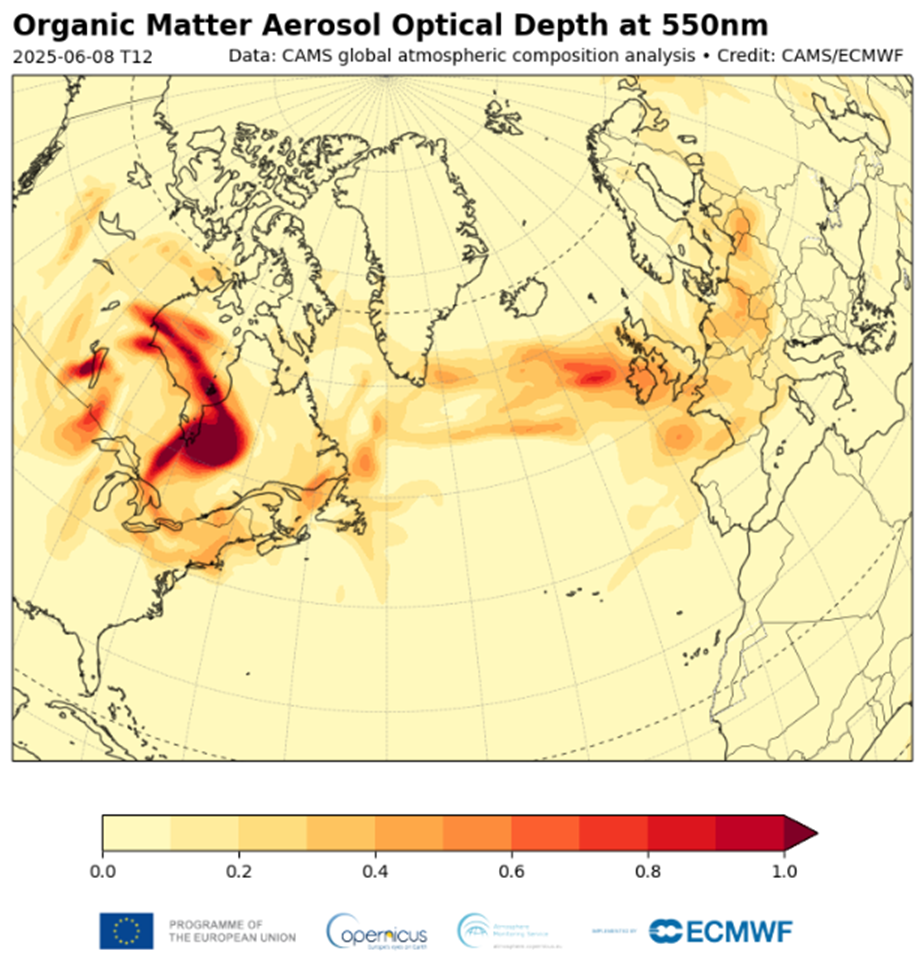
EO data is also used to monitor emissions from wildfires and volcanic eruptions. To this end, the CAMS Global Fire Assimilation System (GFAS) estimates emission fluxes of carbon compounds, particulate matter (PM), and other fire-related atmospheric pollutants based on near real-time satellite observations of fire radiative power. In late May and early June 2025, for example, CAMS monitored emissions from Canadian wildfires and tracked the resulting plumes as they crossed the North Atlantic Ocean, where they were observed over Europe.

While such extreme events highlight the ability of CAMS to monitor cross-border pollution in real time, its role is equally vital in supporting the long-term policy efforts to tackle persistent air quality challenges in Europe. Air pollution remains a major public health concern in Europe, causing health issues and premature death. Efforts to improve air quality in Europe are shaped by European Union legislation, most recently updated through the new Ambient Air Quality Directive (EU/2024/2881) adopted in November 2024. The directive sets legally binding thresholds for concentrations of key outdoor air pollutants which affect human health, including PM10, PM2.5, ozone (O3) and nitrogen dioxide (NO2). To ensure compliance, countries must assess where air pollutant concentrations exceed legal limits and determine their sources. For example, they must identify whether the pollutants come from local, national, or international sources, and whether they are caused by natural events like dust or wildfires, or by human activities such as industry, residential heating, farming, or transport. In this context, CAMS plays an important role, providing decision makers tasked with designing and implementing mitigation strategies with air pollution forecasts and analyses of the main driving factors which affect the evolution of air pollutant concentrations in Europe. These resources, freely available on the CAMS Policy Product webpage, provide European stakeholders access to an array of diagnostics, products, services, and reports.

The new ambient air quality directive encourages Member States to leverage modelling tools to better interpret and assess the spatial distribution of air pollutant concentrations. Notably, the directive explicitly references the use of open-access data from CAMS, recognising the benefits of the service’s tailored products which effectively support its implementation, including:
- Annual air quality assessments and air pollution episode reports for Europe
- European and global forecasts of pollutants
- Forecasts of global dust events and analysis of their contribution to PM concentrations in Europe
- Online tools which analyse PM and ozone levels in over 70 major European cities
“Over the last ten years, under the leadership of ECMWF, CAMS has supported policymakers with insights to help address air pollution and safeguard public health across Europe. By delivering open-access, high-quality data, and forecasts, we’re helping authorities make informed decisions grounded in scientific evidence.” Laurence Rouil, Director of CAMS
C3S: A decade of trusted data advancing climate action and policy
ECMWF has implemented C3S over the past decade, providing insights into key climate trends and achieving major milestones in data provision and analysis. Its work supports international efforts, such as the Paris Agreement, and contributes meaningfully to the United Nations Sustainable Development Goals (SDGs). As an internationally regarded resource, C3S data has become a cornerstone for climate analysis and evidence-based decision-making. In his 2024 ‘Moment of Truth’ speech, UN Secretary-General António Guterres cited data from C3S to emphasise the magnitude of the climate crisis and the urgency of taking immediate action.
One of the flagship publications of C3S, the European State of the Climate report, is published annually in partnership with the World Meteorological Organization (WMO), providing a comprehensive and authoritative assessment of climate trends across Europe and the Arctic. This includes a Graphics Gallery with more than 130 downloadable charts and infographics on temperature, precipitation, flooding, wildfires and other climate indicators, as well as climate action initiatives across Europe.

One of the most notable achievements of C3S is ERA5, its fifth-generation reanalysis dataset, which serves as an indispensable resource for timely and accurate climate data. Its reliability has led to widespread adoption by both the scientific community, including extensive citations in reports from the Intergovernmental Panel on Climate Change (IPCC), and policymakers, with the EU relying on ERA5 data to inform and shape its climate-related policies.
C3S reanalyses and climate projections are also used by the European Climate Data Explorer to provide insights into how climate variability affects energy supply and demand. This tool supports energy providers and grid operators in developing energy systems capable of adapting to evolving climate conditions. Currently, its data is being leveraged to create a climate-resilient electricity grid across Europe in partnership with the European Network of Transmission System Operators for Electricity (ENTSO-E).
“C3S provides trusted climate data that supports informed decisions on adaptation and mitigation strategies. Our goal is to equip policymakers, businesses, and communities with the insights they need to respond effectively to a changing climate.” Carlo Buontempo, Director of C3S
Aside from its scientific and policy relevance, ERA5 is also delivering substantial economic benefits across Europe, underscoring the broader value of C3S data for society and industry alike. The success of ERA5 was highlighted in a recent report assessing the value it generates. Even by conservative estimates, ERA5 delivers annual benefits exceeding €1 billion, representing an economic return at least ten times greater than its total development and operational cost. Its data supports a wide range of applications, such as identifying optimal locations for offshore wind farms, which contributes to annual savings of €30-33 million across Europe.
ERA5 is also used to train artificial intelligence (AI) and machine learning (ML) models for weather forecasting, achieving performance improvements of 10 to 20%. These advances significantly strengthen early warning systems and predictive analytics, with the potential to generate economic gains, which according to the report are estimated between €930 million and €1.34 billion.
Beyond these sectors, the economic value of ERA5 extends across a wide range of industries, including water management, media, tourism, academia, public health, agriculture, and scientific research.

More broadly, C3S continues to play a key role in generating insights on over 20 essential climate variables, supported by an extensive network of more than 100 partner organisations. These include, but are not limited to, the European Organisation for the Exploitation of Meteorological Satellites (EUMETSAT) and its Satellite Application Facilities, the European Space Agency’s (ESA) Climate Change Initiative, as well as collaborations with key international players such as NASA, the National Oceanic and Atmospheric Administration (NOAA) and WMO.
Future directions for CAMS and C3S
As the implementation body for both CAMS and C3S, ECMWF is set to expand the capabilities of the two services by drawing on new data from Copernicus. A new generation of Sentinel satellites will be launched between 2025 and 2028, starting with the Copernicus Sentinel-4 mission, Europe’s first geostationary air quality monitoring instrument, which was placed in orbit on 1 July 2025. CAMS forecasting capabilities will benefit significantly from the hourly data at 8×8 km2 spatial resolution delivered by this new instrument. The forthcoming CO₂ Monitoring and Verification Support (CO2MVS) initiative and launch of Sentinel-5 will further strengthen CAMS data and services. Within C3S, a next-generation ERA6 reanalysis is currently being developed, and will provide even greater accuracy, resolution, and data coverage on climate.
Looking further ahead, ECMWF plans to leverage AI and ML to support key sectors such as energy, finance, agriculture, and emergency management. As CAMS and C3S enter a new decade, their sustained delivery of high-quality, accessible data remains essential to shaping policy and informing decision-making, helping to drive effective environmental measures across Europe and beyond.
[1] ECMWF’s Integrated Forecasting System (IFS) assimilates over 100 satellite data streams for both CAMS and C3S, and a wide range of climate observations for C3S. ECMWF IFS-COMPO is a configurable extension of the IFS used for modelling atmospheric composition.

Thu, 07/08/2025 – 12:00