Category: International News

Drones, Mirrors, Gear Galore—Welcome to a Satellite Validation Event

The Rochester Institute of Technology drove several unmanned aerial vehicles (UAVs) from New York to South Dakota. They attached various instruments to the UAVs, including multispectral visible cameras, hyperspectral imagers, and thermal infrared sensors. (Photo courtesy of Cody Anderson, USGS EROS) While the event centered on one field for about two days, its goal was…
Read more

FY22 U.S. Geological Survey Broad Agency Announcement for 3D Elevation Program Released

On August 16, 2021, the USGS issued the FY22 Broad Agency Announcement (BAA) for 3D Elevation Program (3DEP). The BAA provides a vehicle for partnering with the USGS and other Federal agencies to acquire high-resolution 3DEP data.  The 3DEP BAA is a public process to develop partnerships for the collection of lidar and derived elevation data for 3DEP. The 3DEP BAA provides an opportunity for ongoing national collaboration so that Federal,…
Read more

New Data Access Tool Offers Faster, More User-Friendly Landsat Experience

A new and improved data tool released by the USGS, known as LandsatLook 2.0 Viewer, will make it easier and faster to access earth imagery and simpler to analyze through the use of cloud-based systems. Screenshot from the USGS LandsatLook 2.0 viewer. The updated tool allows users to combine bands for their area of interest…
Read more

Questions asked frequently at NEONASA Earth Observations (NEO)on September 4, 2020 at 12:00 am

After many years of serving the public with global visualizations of Earth’s system processes, we gathered the most frequent questions visitors of our site ask and answered them for you. The FAQs page can be found on the home page and lives here: https://neo.sci.gsfc.nasa.gov/faq/. Please look these questions over and see if they answer questions…
Read more

Visualizing Changes in Nitrogen Dioxide Levels During the COVID-19 PandemicNASA Earth Observations (NEO)on August 12, 2020 at 1:20 pm

On March 11, 2020, COVID-19 was classified as a global pandemic by the World Health Organization. That same month, all New York City non-essential businesses were ordered to close by the governor’s office and several residents fled the city to get away from the rapidly spreading virus. There is typically a significant amount of nitrogen…
Read more

Create and Apply the Right Color Palette in Adobe Photoshop for your Map Visualization (Part 1 of 3)NASA Earth Observations (NEO)on October 16, 2020 at 2:58 pm

Applying the right color palette to an image is crucial to conveying the right message to your audience. There are obvious no-nos in map-making like, do not color land and water blue because it may look like your entire map is water. Or, do not color a disaster map green because it may convey a…
Read more

How to Visualize NEO Imagery in ExcelNASA Earth Observations (NEO)on September 15, 2020 at 3:37 pm

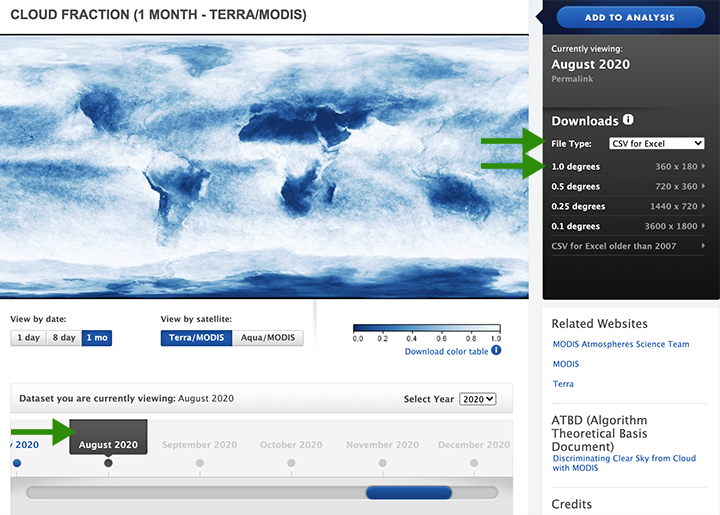
Did you know you can use Excel to visualize raster datasets? If not, follow this short tutorial and find out how. Let’s use the cloud fraction imagery NEO provides for this example. Step 1. Go to the cloud fraction imagery page and choose the CSV for Excel download option from the drop-down at 1.0-degree resolution…
Read more

View NEO Imagery on a SphereNASA Earth Observations (NEO)on November 23, 2020 at 10:12 pm

There are several companies and organizations that provide spherical projector technology, but the first one I had ever heard of was Science on a Sphere (SOS) created by the National Oceanic and Atmospheric Administration (NOAA). Originally envisioned in 1995 by Dr. Alexander “Sandy” MacDonald and later patented in 2005, these Science on a Spheres (and…
Read more

Raster and Floating Point GeoTIFFs: What is the difference?NASA Earth Observations (NEO)on December 23, 2020 at 10:59 pm

When you are considering which format to download for a NEO image, there are two GeoTIFF format options: GeoTIFF (raster) and GeoTIFF (floating point). This can be confusing at first. Let’s take a look at both examples using the Chlorophyll Concentration dataset to distinguish the two formats. Here is a screenshot showing the Downloads box…
Read more

How To Add Country Labels to Your NEO ImageNASA Earth Observations (NEO)on April 19, 2021 at 3:09 pm

We recently received an email about adding country labels to a NEO image to better understand where certain data points are in the world. Here is one way to add labels to any NEO image in QGIS. QGIS is a free and open-source Geographic Information System. If you do not have QGIS on your machine,…
Read more